
Contents
Overview
Analytics provides a centralized set of reporting, dashboarding, and scheduling capabilities that help users understand their financial, customer, and operational data in one place. With intuitive navigation, advanced filtering, flexible report builders, and automated report schedules, Analytics supports both quick insights and in-depth analysis for advanced use cases.
Analytics includes Reports, Dashboards, and Report Schedules, enabling users to analyze data, visualize key metrics, and automate report delivery.
Accessing Analytics
Analytics can be accessed from the main navigation and includes Reports, Dashboards, Report Schedules, and Export History enabling users to analyze data, visualize key metrics, and automate report delivery.
Dashboards
Dashboards provide a high-level, visual summary of key financial and revenue metrics, allowing users to quickly monitor performance and trends without running individual reports.
Dashboards are accessible from Analytics → Dashboard and are designed for at-a-glance insights, with interactive filters and visual components.
Currently Available Dashboards
- AR Dashboard: The AR Dashboard provides an overview of Accounts Receivable (AR) performance, helping users track invoicing, payments, and outstanding balances.
- ARR Summary Dashboard: The ARR Summary Dashboard provides a consolidated view of Annual Recurring Revenue (ARR) performance and retention metrics.
Reports
Reports allow users to analyze data in detail using tabular views with filtering and grouping capabilities. Users can build reports using different report builders based on their needs, run and customize reports, drill into underlying data, and export results for further analysis.
Reports are designed for both ad hoc analysis and repeatable reporting, supporting customer-level and subscription-level insights depending on the report type.
The following topics are covered in this section:
To access Reports, navigate to Analytics → Reports.
Reports Page
The Reports page is the central workspace for viewing, creating, organizing, and managing all Analytics reports.
 Key Capabilities
- Unified View: All Standard Reports and Custom Reports are consolidated in one place.
- Improved Search & Filters: Locate reports using keyword search, saved filters, and sorting by last modified date.
- Folder-Based Organization: Reports are grouped by categories such as Revenue, ARR & MRR, Invoices, Customer, and more.
- Quick Actions: Access Schedules, create folders, or add reports.
Simple vs. Advanced Report Builder
Ordway offers two report-building modes to support different levels of analysis.
Simple Report Builder
The Simple Report Builder allows users to select existing data fields and views them in a basic tabular (raw CSV-style) format. It is designed for straightforward data extraction and does not support customisation of data fields or visual presentation.
Limitations
- Only existing fields can be selected
- No support for custom dimensions or custom measures
- No table calculations
- No pivoting or row grouping
- No data manipulation
- No visualizations
This builder is best suited for quick data review and raw data export, rather than analytical or visual reporting.
Advanced Report Builder
The Advanced Report Builder is designed for complex and highly customizable reporting.
Key Capabilities
- Group and aggregate data
- Apply multiple filters
- Create calculated fields
- Add visualizations
- Build reports using the same datasets as Standard Reports
Report Descriptions
Each Analytics Report includes a detailed description explaining:
- What the report shows
- Which data sets are used
- Common business use cases
This helps users quickly determine whether a report fits their needs before running or customizing it.
Report Actions & Management
Both Standard Reports and User-Created Reports support a wide range of actions, including:
Report Actions Overview
Based on user permissions, the following actions can be performed on reports:
| Action | Description |
| Run Report | Executes the report to display the most recent data |
| Share Report | Shares the report with other users |
| Add Report | Creates and saves a new report |
| Edit Report | Modifies an existing report’s fields, filters, or layout |
| Delete Report | Deletes reports that are no longer required |
| Download | Exports report results for offline use |
| Add to Folder | Organizes reports by adding them to folders |
| Clone | Creates a copy of an existing report |
| Schedule | Schedules reports for automated delivery |
| Customize | Customizes report fields, filters, and layout |
Report Page Navigation & UI
The Analytics → Reports page is the central place to view, search, organize, and manage reports. This section explains each part of the interface and how you can interact with it.
The below are the topics covered:
- Global Navigation (Left Navigation Menu)
- Filter & Saved Filters
- Action Buttons (Top Right)
- Folder Panel
- Reports List (Main Table)
- Quick Tip
Global Navigation (Left Navigation Menu)
The Left Navigation menu is the primary way to move across major areas of the Ordway application. It provides quick access to both operational modules and Analytics features, allowing you to switch contexts without leaving their workflow.
The below is the sample Left Navigation menu in Ordway: Click the image to view in full size
Analytics
When Analytics is selected in the Left Navigation menu, it expands to show:
- Dashboard: View high-level visual insights and KPIs
- Reports: Access standard and custom reports, including ARR, MRR, revenue, and customer analytics
- Schedules: Manage scheduled reports and automated deliveries
Click the image to view in full size
The Analytics section indicates the current active area, helping users easily identify where they are within the application.
Filter & Saved Filters
Filters allow users to refine report results by limiting the data displayed based on selected criteria. Applied filters affect the report output immediately and remain active until they are cleared or replaced.
Filters
- Opens advanced filtering options
- Allows filtering by:
- Name
- Description
- Created By
- Visibility
- Last Modified
Click the image to view in full size
width="624" height="225"
Saved Filters Dropdown
Saved Filters allow you to store frequently used filter combinations and quickly reapply them, ensuring consistency and saving time when accessing commonly used report views.
- Apply previously saved filter combinations
- Helps users quickly access commonly used report views
Click the image to view in full size
width="624" height="223"
Action Buttons (Top Right)
The action buttons provide quick access to commonly used report management actions.
Click the image to view in full size
Action Button Overview
The below table lists action button and their description:
| Action Button | Description |
| Schedules | View and manage scheduled reports. Automate report delivery at defined intervals. |
| New Folder | Create folders to organize reports. Useful for grouping reports by team, use case, or department. |
| + Add | Create a new report. Choose between the Simple or Advanced Report Builder. |
Folder Panel (Left of Report List)
The folder panel organizes reports into logical categories.
Folder Panel – Common Folder Types
The below table lists common folder type names and their description:
| Folder Name | Description |
| All Reports | Displays all reports you have access to, including standard and custom reports. |
| All Custom Reports | Displays reports created by users. |
| ARR & MRR | Contains reports related to Annual and Monthly Recurring Revenue analysis. |
| Revenue | Includes reports focused on revenue tracking and analysis. |
| Aging | Contains reports related to aging metrics such as A/R aging. |
| Account Balance | Includes reports showing account balance information. |
| Invoice & Payments | Contains reports related to invoices, payments, and collections. |
| My Reports | Displays reports created by you. |
| Shared With Me | Displays reports shared with you by other users. |
Note: The number next to each folder shows how many reports it contains.
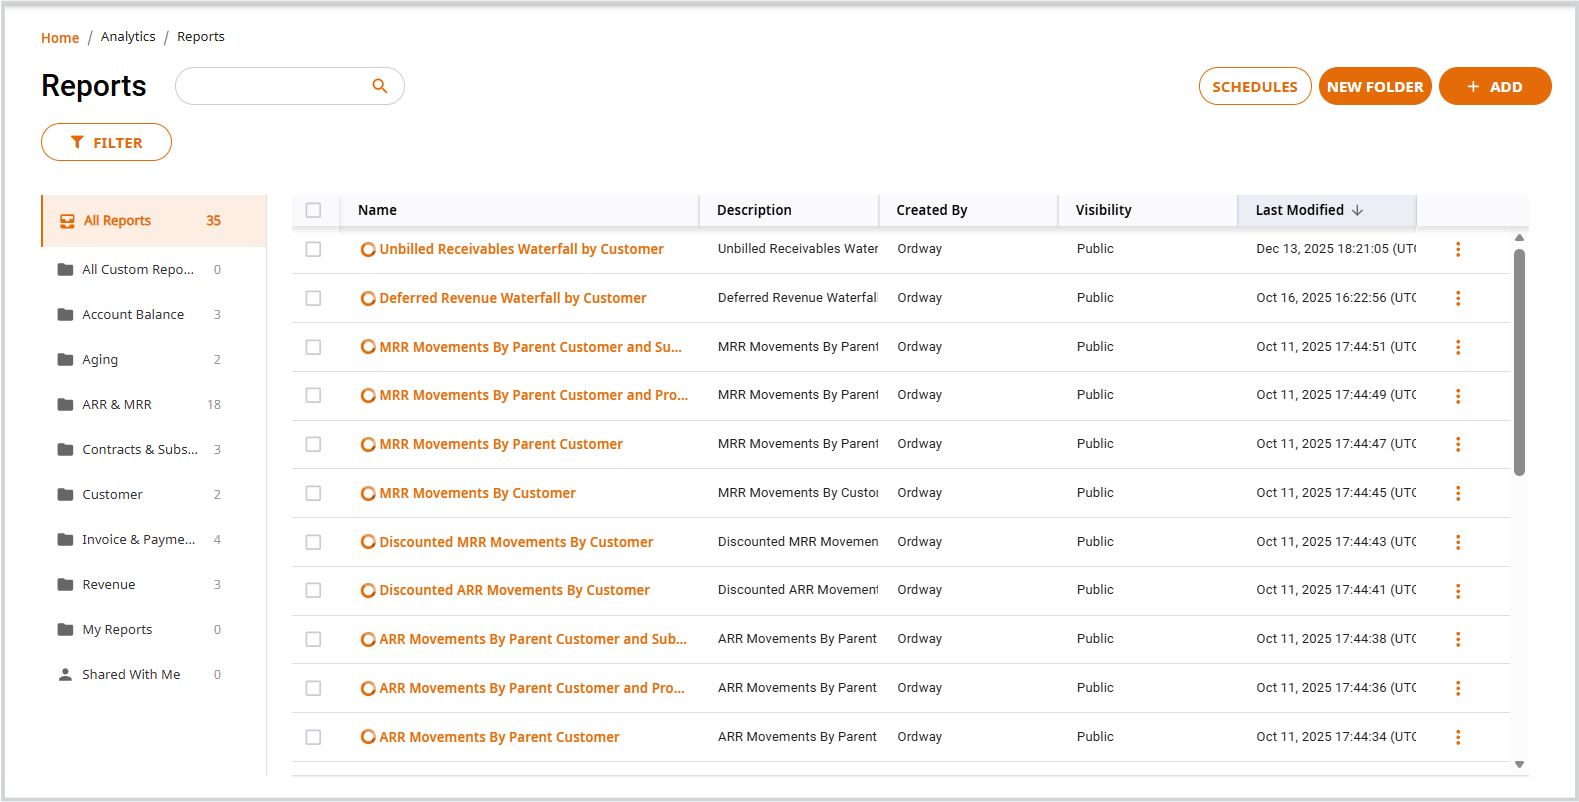
Reports List (Main Table)
This table displays all reports within the selected folder and provides quick access to report details and actions.
Report List Columns Overview
The below table lists report list column names and their description:
| Column | Description |
| Checkbox | Select one or more reports to perform bulk actions. |
| Name | Click the report name to open and run the report. |
| Description | Provides a brief summary of what the report contains. |
| Created By | Displays the name of the user who created the report. |
| Visibility |
Indicates who can access the report: • Public – Visible to all users • Private – Visible only to the creator |
| Last Modified | Shows when the report was last updated. This column can be sorted. |
| More Actions (⋮) | Opens additional options such as View, Add to Folders, Download, Clone, Schedule, and Customize. |
Schedules
Schedules enable you to automate report execution and delivery. Users can schedule reports to run at defined intervals, select recipients, choose export formats, and monitor schedule status and run history from a centralized view.
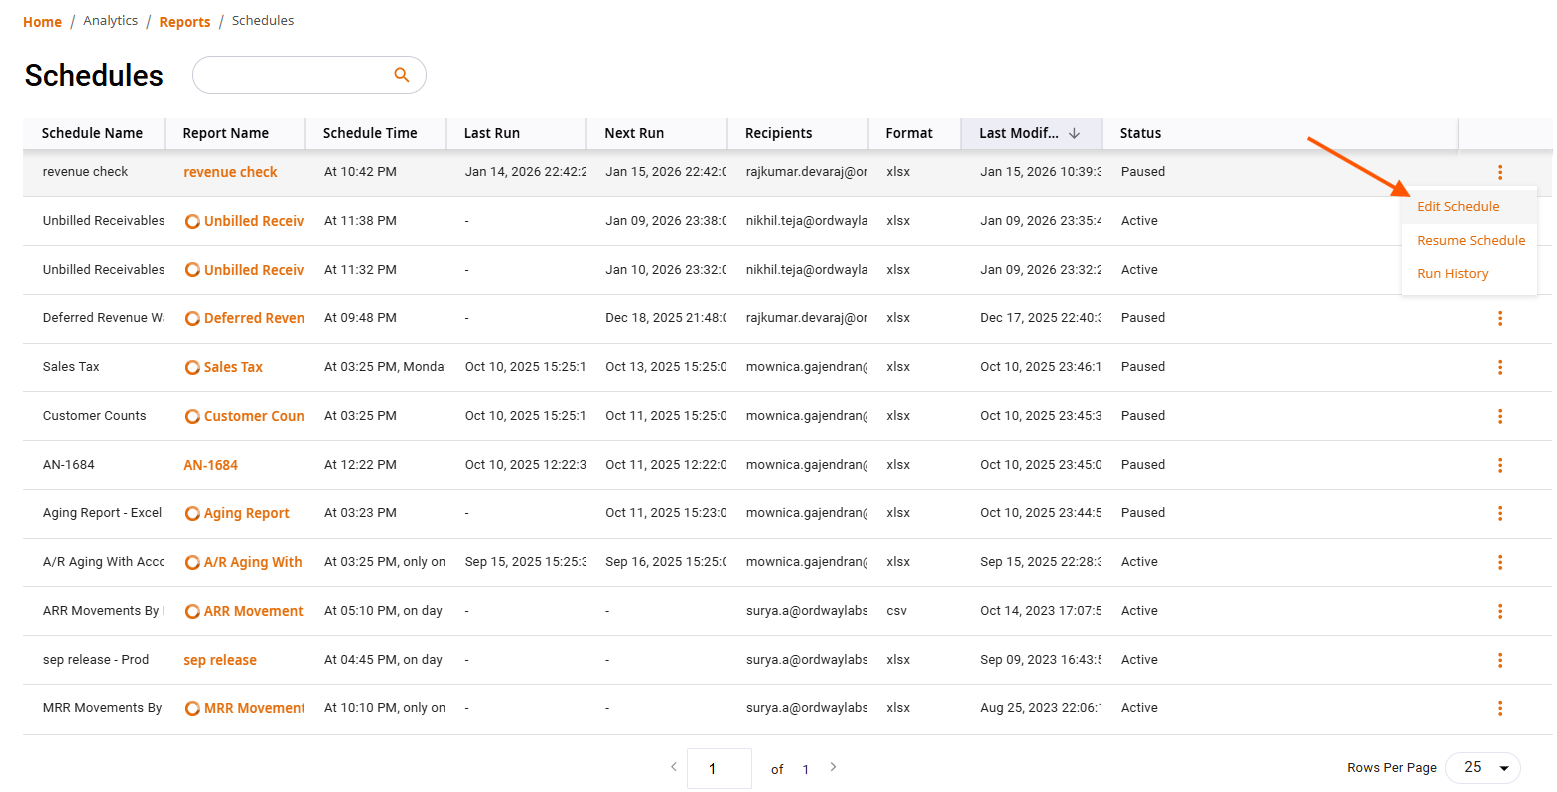
View Schedules
The Schedules page allows users to manage automated report deliveries. From this page, users can view, edit, and monitor all scheduled reports in one place.
Schedules page Columns Overview
The schedules display the following details:
| Column Name | Description |
| Schedule Name | Name of the scheduled job |
| Report Name | The report being scheduled |
| Schedule Time | When the report is scheduled to run |
| Last Run | The most recent execution time |
| Next Run | The upcoming scheduled execution |
| Recipients | Users who receive the scheduled report |
| Format | Export format (for example, XLSX or CSV) |
| Last Modified | Last updated date and time |
| Status | Indicates whether the schedule is Active or Paused |
Available Actions
Using the action menu, users can:
- Edit Schedule – Modify schedule timing, recipients, or format
- Resume / Pause Schedule – Enable or temporarily stop scheduled runs
- View Run History – Review past execution details and outcome
Quick Tip
Use folders + search + filters together to quickly locate the exact report you need.
Comments
0 comments
Please sign in to leave a comment.